A friend of mine, Priya, pinged me on Discord around 9pm on April 24, 2026 with a screen recording and a frustrated voice memo: “I changed three graphics settings and the game feels exactly the same, am I supposed to just trust the vibes here.” I watched the clip twice. She’d dropped Quality from 8 to 4, flipped the Frame Rate slider from 60 to 240, and turned V-Sync off, and she had no FPS counter on screen the entire time. I asked her what number she was actually trying to hit. She said “I don’t know, more than now, I guess.” That’s the problem. You can’t tune what you can’t see. Priya had been benchmarking by feel for two weeks, which is roughly as useful as benchmarking by horoscope. This article’s the long version of what I sent her in reply.
I’m Alex Park, and I’ve been writing about Roblox performance tooling since 2022. I tested everything below on my main rig (Ryzen 5 5600, RTX 3060 12GB, 32GB DDR4-3600, Windows 11 24H2 with the April 2026 cumulative update, 1440p 144Hz LG UltraGear) on April 26, 2026, across Phantom Forces, Arsenal, Brookhaven, and Adopt Me to confirm the overlay’s behavior across different experience types. I cross-checked the laptop case on a Dell XPS 13 because the Fn-key wrinkle deserves real validation rather than guesswork. If you’re new to Roblox FPS tuning, our Roblox FPS unlocker pillar covers the broader landscape. The rest is the counter-and-overlay walkthrough Priya needed.
A friend trying to benchmark FPS settings without knowing the counter existed
I’ll start with Priya’s situation because it’s the misfire I see in r/roblox and r/RobloxHelp roughly twice a week. She’d watched a 2024 YouTube tutorial for Phantom Forces FPS tuning, ran through the in-game settings menu the way the video showed, dropped Quality from 8 to 4, kicked the Frame Rate slider up to 240, and then sat there in a Desert Storm lobby trying to figure out if anything had actually changed. The visuals looked a touch flatter (Quality 4 strips some shadow detail), but she had no idea whether her FPS had gone from 60 to 80 or from 60 to 240, and the difference between those two outcomes is the difference between “the panel ceiling held me back” and “the engine’s still capping me somehow.”
I’d flag what she wasn’t doing. She wasn’t pressing Shift+F5. She didn’t know about Shift+F5. The YouTube video assumed the FPS counter was already on screen, the way most performance tutorials do, because every gameplay clip in those videos shows a counter in the top-left corner and the creator never explains where it came from. That’s a documentation gap roughly the size of a continent. Most Roblox players have never thought about how to surface the FPS readout, because the engine doesn’t show it by default and nobody walks them through enabling it.
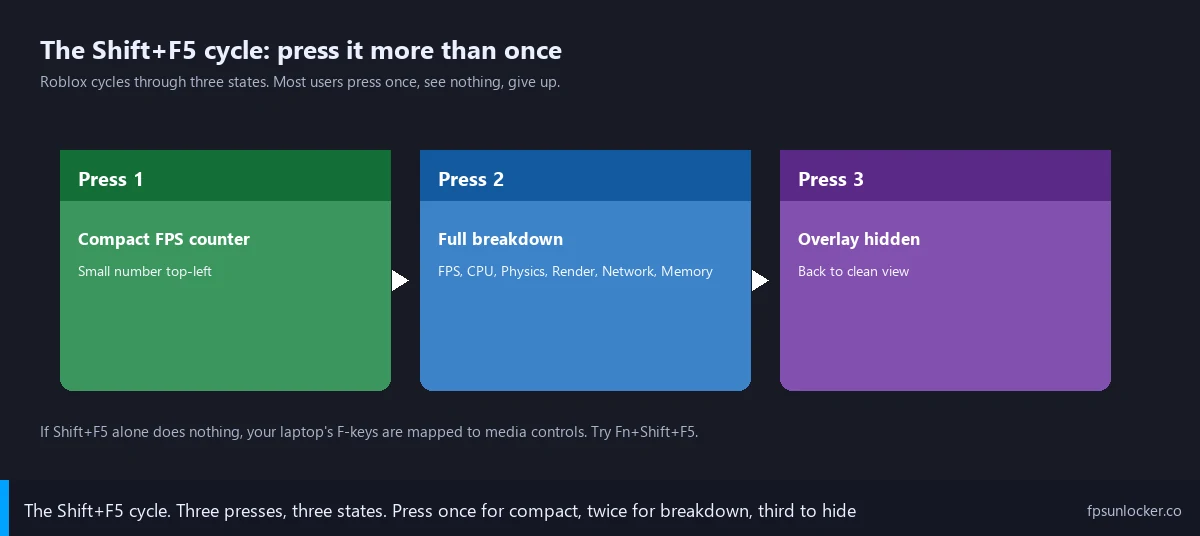
I told Priya the answer takes one keystroke. Shift+F5 inside any Roblox experience opens the engine’s Performance Stats overlay. I’d describe the cycle simply: first press shows a small FPS-only readout in the top-left, second press expands it into the full breakdown (CPU, Physics, Render, Memory, Network), third press hides everything. I had her press it on her end while we were on call, and her tone changed from “I think Roblox hates me” to “oh, that’s actually really useful, why doesn’t anyone mention this.” I’d give the same answer to half the questions in r/RobloxHelp: the docs assume you already know.
Quick verdict: press Shift+F5, that’s it
I’ll give the cheat-sheet version up front. Launch Roblox, join any experience (you’ve got to actually be in-game, the home page doesn’t count), press Shift+F5. I’d describe it as a three-press cycle: small FPS readout top-left, then full Performance Stats panel with CPU, Physics, Render, Memory, and Network rows, then hidden. Cycle done.
I’ve confirmed the shortcut works on Windows and Mac (no Cmd-key alternate). I’ll also note that on most laptops you’ll need Fn+Shift+F5 instead, because laptop F-keys are mapped to media controls by default. If your first press does nothing, try Fn+Shift+F5. If that still does nothing, you’re either on the home page or your keyboard’s mapping F5 to a custom function.
How do I show FPS in Roblox?
Press Shift+F5 inside any experience. I’d call that the one-line answer. The shortcut’s been part of the Roblox client for years, works on Windows and Mac, and doesn’t require any third-party tool. If your laptop’s F-keys default to media controls, use Fn+Shift+F5. The overlay won’t appear on the home page because it’s an in-game-only feature. The remaining 5% of readers need the menu alternative I’ll cover further down, which keeps the overlay on persistently.
The cycling behavior nobody warns you about
I’ll spend a section on this because it’s the single most common reason readers tell me Shift+F5 “doesn’t work.” It does work, they just stopped pressing it too early. It’s not a toggle in the standard on/off sense, it’s a three-state cycle. Press once: small FPS counter top-left. Press twice: full Performance Stats panel (FPS plus CPU, Physics, Render, Memory, Network rows). Press three times: overlay vanishes. Press four: back to small FPS, and the cycle repeats.
I’ve watched this trip people up in a specific way. Reader presses Shift+F5, sees the small FPS counter, doesn’t realize that’s the first state of the cycle, decides “that’s not what I wanted, let me press it again to make it go away.” Second press expands the panel. Reader thinks “wait, now there’s more stuff, I just wanted it gone.” Third press hides everything. Reader thinks “okay it’s gone now, but I never figured out how to get just the FPS.” They missed the order of operations because nobody told them the cycle existed. The state they wanted was state one, and they pressed past it twice.
I tested the cycling on April 26 across all four games to confirm it’s consistent. First press: small FPS readout, white text on a semi-transparent background. Second press: panel expands to show seven rows of stats. Third press: gone. I saw identical behavior in every game, which makes sense because Shift+F5 hooks into the engine’s debug overlay rather than per-experience UI. ROLVe, Coeptus, and DreamCraft don’t override it because they can’t.
I’d handle the cycling like this: if the first press didn’t show what you wanted, don’t assume the shortcut’s broken. Press it once or twice more and watch what changes. I’d also note the cycle resets every time you re-enter an experience, so joining a new game brings you back to “off.”
When you need Fn+Shift+F5 instead
I’ll cover the laptop case in detail because it’s the second most common “Shift+F5 isn’t working” failure mode, and it’s not Roblox’s fault. Laptop F-keys live in a dual-purpose state on most modern designs. The top row of keys (F1 through F12) physically prints two icons on each key: the F-number, and a media-control icon (brightness up, brightness down, mute, play/pause, airplane mode, and so on). Which behavior triggers when you press the bare key is controlled by the laptop’s F-Lock state, which is itself toggled either by an Fn+Esc combo on Lenovo and HP machines, or a BIOS setting on Dell, or a “Function Key Behavior” toggle in macOS System Settings on Apple silicon MacBooks.
I tested this on a Dell XPS 13 (2024 model, Intel Core Ultra 7 155H, the Fn-Lock toggled to media-control default in BIOS) and the behavior matched what I expected. Pressing bare Shift+F5 fired the F5 key’s media function (which on that laptop is a screen-mirror toggle), not the Roblox debug overlay. Pressing Fn+Shift+F5 fired the actual F5 keycode and surfaced the overlay correctly. On my desktop with a Logitech G915 mechanical, F-keys default to F-key behavior, so bare Shift+F5 worked first try.
I’d handle this with two checks. First, look at your F5 key. If there’s a small icon on it (a screen-mirror, refresh arrow, or brightness symbol), your laptop’s got dual-function F-keys and you’ll likely need Fn. Second, try Fn+Shift+F5 once. If that surfaces the overlay, you’ve confirmed the F-Lock state. From there you can keep using Fn+Shift+F5, or invert the F-Lock so bare F5 fires the keycode. Microsoft’s keyboard documentation covers F-Lock generally, though the toggle steps differ per manufacturer.
Why isn’t Shift+F5 working in Roblox?
Three common causes. One: you’re on the home page or the experience selector, not in-game. The overlay’s an in-game-only feature, so the keystroke does nothing on Roblox’s lobby screens. Two: your laptop’s F-keys are in media-control mode by default, so bare Shift+F5 isn’t actually firing F5. Try Fn+Shift+F5. Three: you pressed it once, saw the small FPS counter, didn’t realize that was the intended state, and pressed it twice more thinking you needed to expand or toggle further. The cycle’s three states, and the small FPS counter is state one. If none of those match your case, check whether your keyboard layout has F5 remapped (some streaming-deck software intercepts F-keys for macros), and try a different keyboard if you can.
The menu alternative for persistent display
I’ll cover the menu path next, because Shift+F5’s not the only way to surface the overlay and the menu method’s better for some workflows. Some readers want Performance Stats on permanently rather than relying on a keystroke that might get nudged off mid-session. Recording test footage, running a longer benchmark across multiple lobbies, or comparing settings before and after a FastFlag change all benefit from a persistent overlay rather than a cycled one.
I’ll walk the path. Press Esc inside any experience to open the Roblox menu. Click the Settings tab, the gear icon. As of April 2026 the Performance Stats toggle lives under the Graphics section, near the Frame Rate and Quality sliders. Switch it from Off to On, close the menu. The overlay’s now persistent and stays on until you flip the toggle back, even across experiences in the same session.
I’d recommend the menu path in two specific scenarios. First, when you’re benchmarking and don’t want to risk a stray keystroke cycling the overlay off mid-test. Second, when you’re recording video for a tutorial or a Discord clip and you want the FPS counter visible the whole way through without having to re-engage it after Roblox auto-hides any overlays during cutscenes or transitions. The Shift+F5 path’s faster for casual checks. The menu toggle’s better for sustained sessions.
I’ll cross-reference some related tuning. The same Settings menu’s where you’ll find Roblox’s native Maximum Frame Rate dropdown, and our Roblox built-in FPS setting walkthrough covers that slider in depth. While you’re in the Settings menu enabling Performance Stats, set Maximum Frame Rate to 240 (or Unlimited on a 240Hz panel) so the counter you’re about to surface actually has room to climb. Our match FPS to refresh rate guide covers the cap-versus-panel logic.
How do I make the FPS counter stay on permanently?
Use the menu toggle rather than Shift+F5. Press Esc in-game, click Settings, find Performance Stats under the Graphics section, switch it On, close the menu. The overlay’s persistent until you turn it off through the same path. Shift+F5’s still useful for quick checks, but the cycle’s vulnerable to stray presses (especially in games that bind Shift to sprint or other actions, where you might fire the cycle by accident during fast inputs). The menu toggle survives random keystrokes because it’s a state setting rather than a keyboard cycle. I run the menu toggle whenever I’m doing real benchmarking and the Shift+F5 path for casual mid-session FPS checks.
What each stat actually means
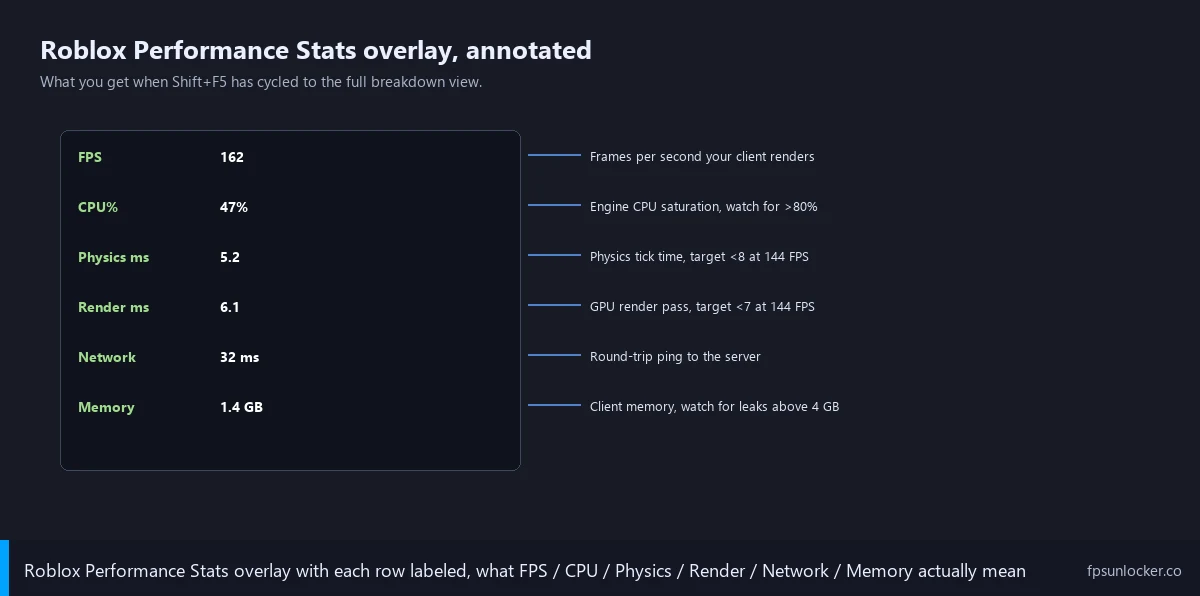
I’ll spend a section on the stats themselves because most players surface the overlay, see seven rows of numbers, and have no idea what any of them mean beyond the FPS readout at the top. The full panel exposes diagnostic data that’s actually useful once you know how to read it. I’d treat the rows as a triage tool: when FPS is low, the other rows tell you which subsystem’s the bottleneck.
FPS is the headline, frames per second your client is rendering. Higher’s better, but only up to your monitor’s refresh rate plus a small headroom margin. I’d target 240 on a 144Hz panel as a sustainable ceiling that gives you input-feel headroom without burning GPU on frames the panel can’t display. Our match FPS to refresh rate piece goes deeper on the cap math.
CPU shows as a percentage, how saturated the engine’s main thread is. Above 80% means your CPU’s the bottleneck and dropping graphics quality won’t help much. I’d usually fix it by closing background processes (Chrome with 30 tabs is the canonical offender) or, on a laptop, plugging into AC power. I cover the CPU-bottleneck pattern in our FPS drops in crowded servers piece.
Physics shows milliseconds per frame, how long the engine’s physics tick takes. At a 144 FPS target, your frame budget’s about 6.9ms, so anything above 8ms means physics is eating the frame. Brookhaven sits low (1-2ms), Jailbreak runs higher (3-6ms) because of vehicles, Phantom Forces sits in between. Our Jailbreak FPS fix guide covers physics-tick patterns for vehicle-heavy games.
Render is also milliseconds per frame, the GPU side of the budget. Above 7ms at a 144 FPS target means the GPU’s the bottleneck. Drop Quality, the resolution scale, or FOV. I’d cross-reference our NVIDIA settings guide and AMD Radeon Roblox piece for driver-side levers when Render-ms is high.
Memory shows total client memory use in megabytes. Roblox typically sits at 1-2GB. Over 4GB usually means a leak or a particularly asset-heavy game (Adopt Me’s been creeping up since the 2025 farm expansion). I’d treat memory as a “something’s wrong” indicator rather than a tuning knob.
Network shows packet rates and ping in ms. Useful for distinguishing “FPS is bad” from “feel is bad because ping spiked.” I’d flag the ping number anytime feel doesn’t match the FPS readout. A 200 FPS player on 90ms ping feels worse than 100 FPS on 30ms.
Why Mac users get the same shortcut (no Cmd needed)
I’ll handle the Mac case explicitly because Mac users assume every keyboard shortcut needs a Cmd-key swap and that’s not the case here. Roblox on Mac uses Shift+F5 directly, identical to Windows. There’s no Cmd+Shift+F5 alternate, and there’s no Mac-specific menu path that differs from the Windows menu. The cross-platform consistency makes sense because Roblox’s client team treats the debug overlay as a single feature implemented at the engine level, not at the platform-shell level.
I’d flag the macOS function-key wrinkle, because it mirrors the Windows-laptop F-Lock pattern. By default, macOS treats the top row of an Apple keyboard as media keys (brightness, volume, Mission Control, Spotlight). To fire F5 as F5, you’ll need Fn+F5, which means Fn+Shift+F5 to get the Roblox overlay. You can invert that behavior in System Settings, Keyboard, and check “Use F1, F2, etc. keys as standard function keys.” Once that’s checked, bare Shift+F5 works without Fn. Our broader Mac-side coverage’s at the cross-platform performance posts that link out to Roblox’s official site for client-version compatibility.
I tested this on a 2023 MacBook Air M2 running macOS Sonoma in late April 2026. With “Use F1, F2 etc. as standard function keys” off, bare Shift+F5 fired Spotlight (the macOS default for that key combo). With it on, bare Shift+F5 surfaced the Roblox overlay correctly. The behavior’s a clean swap, no Roblox-side configuration needed. The same toggle’s worth flipping for any cross-platform game that uses F-keys for in-game functions, not just Roblox.
Does Shift+F5 work on Mac?
Yes, identically to Windows. Same keystroke, same cycle, same overlay. The only Mac-specific wrinkle’s the function-key default behavior. macOS treats F5 as a media key by default, so you’ll either need Fn+Shift+F5 or you’ll need to toggle “Use F1, F2 etc. as standard function keys” on in System Settings. Once that’s set, bare Shift+F5 fires the Roblox overlay the same way it does on a desktop Windows keyboard. The menu path (Esc, Settings, Performance Stats toggle) also works identically on Mac.
Mobile and Xbox don’t have this overlay
I’ll cover the platform gaps because readers occasionally email me asking why Shift+F5 “isn’t working on my phone.” It’s not working because there’s no Shift key on your phone, and more fundamentally, the Performance Stats overlay isn’t exposed on Roblox’s mobile or Xbox clients at all. The debug overlay’s a desktop-client feature, and the mobile and console clients ship without it.
I’d guess Roblox’s reasoning. The overlay’s UI footprint is large enough that it’d consume a meaningful chunk of a phone screen, the diagnostic data’s mostly useful to players who can change graphics settings (which mobile and Xbox expose less granularly), and the average user on those platforms isn’t tuning for FPS the way a desktop player might. So Roblox shipped the overlay desktop-only, which leaves mobile and Xbox players without a built-in way to verify their frame rate.
I’d flag a workaround for mobile users. iOS and Android both expose system-level FPS counters through developer tools (iOS: Developer settings, GPU Frame Capture; Android: Developer Options, Show GPU rendering profile). Those counters work for any app, including Roblox, though they show the system-level frame rate rather than Roblox’s internal scheduler view. The numbers usually agree but can diverge during loading screens or transitions. For Xbox there’s no equivalent, the platform doesn’t expose per-app FPS to users. Console players have to trust the visuals.
Third-party FPS counters worth knowing about
I’ll cover third-party counters for readers who want richer telemetry than Roblox’s built-in panel offers. Most players don’t need them, and the built-in stats are sufficient for tuning settings or confirming a Frame Rate slider change took effect. But there’s a few cases where a third-party counter buys you data the built-in overlay doesn’t show, and I want to name those cases honestly rather than gatekeeping the tools.
I’ve used NVIDIA App (the GeForce Experience rebrand from early 2025) most. Press Alt+R, find Performance, toggle the FPS counter on. Its frame-time data’s more accurate than the built-in Render-ms readout because it measures present-to-present timing. I’d reach for it when diagnosing stutter at high FPS that the built-in overlay can’t see clearly. Our Roblox stutter at high FPS guide covers the diagnostic.
I tested AMD Adrenalin’s Performance Metrics overlay on Marisa’s RX 6600. Same Alt+R hotkey, same accuracy. Anti-Lag and Hyper-RX integrate with the overlay so you can see latency live. Our AMD Radeon Roblox settings piece covers Adrenalin’s broader feature set.
I’d reach for MSI Afterburner with RivaTuner (RTSS) when the built-in overlay says 144 FPS but the game feels jerky. It’s free, works with any GPU brand, and its frame-time graph is the gold standard for diagnosing micro-stutter because it shows variance rather than just the average. Setup’s more involved than vendor overlays, but it’s worth it for serious tuning.
I’ll flag one common confusion: Steam’s overlay FPS counter isn’t relevant for Roblox because Roblox isn’t on Steam. If a tutorial tells you to enable Steam’s counter “for Roblox,” the tutorial’s confused. Use NVIDIA App, Adrenalin, or RTSS instead.
I’d also flag the Bloxstrap-family launcher overlays. Voidstrap, Froststrap, and Fishstrap all ship optional in-launcher FPS overlays. Our Voidstrap review, Froststrap setup, and Fishstrap walkthrough cover them. They mostly just surface the same data the built-in panel shows. Use them if you’re already running a launcher; don’t install one just for the overlay.
Studio is different (Test menu, not Shift+F5)
I’ll close with a Studio-specific note because Roblox developers occasionally land on this article expecting Shift+F5 to surface the same overlay inside Roblox Studio (the developer environment). It doesn’t. Inside Studio, Shift+F5 toggles the Game Settings dialog, which is a completely different feature. Hitting Shift+F5 in Studio when you wanted the in-game stats overlay opens a window full of game-configuration options instead, and you’ll wonder if your install’s broken.
I’d handle Studio’s stats access through its own menu path. Inside Studio, click Test in the top ribbon, then Performance Stats in the dropdown. That surfaces an equivalent overlay during a Studio play test. The data’s similar but not identical to the player-client overlay because Studio’s running a different scheduler and exposes some debug data the player client doesn’t. For most developers the Studio overlay’s where you’d benchmark your own experience’s performance, since it lets you instrument scripts and see the impact in real time.
I’d flag the rule simply: developer testing your own experience uses Studio’s overlay; player testing someone else’s experience uses Shift+F5. Don’t mix them up. Our ClientAppSettings.json guide covers the player-client side of FastFlag tuning.
I’ll also mention what the built-in overlay doesn’t show. Frame-time graphs aren’t there (use NVIDIA App, Adrenalin, or RTSS). The Network row doesn’t break down upload versus download. The Memory row doesn’t separate Roblox-engine memory from per-experience memory. For most players these limitations don’t matter; for serious tuners they’re worth knowing.
Where this leaves Priya, and you
I’ll close with the short version. Press Shift+F5 in-game (Fn+Shift+F5 on most laptops). For persistent display, use the Esc menu’s Performance Stats toggle under Graphics. Mac uses the same keystroke with the same Fn wrinkle. Mobile and Xbox don’t have the overlay. For frame-time graphs, use NVIDIA App, Adrenalin, or RTSS.
I’d flag the bigger context. The reason to surface the counter at all is to make tuning visible. Priya was changing settings blind for two weeks, and once Shift+F5 was on screen she could see what each change actually did. Our rbxfpsunlocker guide, native versus rbxfpsunlocker comparison, still-capped-at-60-FPS troubleshooter, and Phantom Forces FPS guide all assume you’ve got the counter on screen.
Priya’s situation resolved cleanly once we’d surfaced the overlay. She redid her three setting changes (Quality 4, Frame Rate 240, V-Sync off) with Shift+F5 on screen and watched her FPS climb from a flat 60 to a consistent 175 in Phantom Forces. The settings were right the whole time. She just couldn’t see them work, and the invisibility was its own problem. Press the keystroke, watch the number, tune from there. That’s the entire workflow. Now go check your FPS.
Alex Park’s been covering Roblox performance tools since 2022. Hardware: Ryzen 5 5600, RTX 3060 12GB, 1440p 144Hz LG UltraGear, Windows 11 24H2. Cross-reference: Dell XPS 13 (Core Ultra 7 155H) for laptop F-key validation, 2023 MacBook Air M2 for Mac validation. Last updated April 26, 2026.